Industry 4.0 is all about data.
While the first industrial revolution centered around steam engines, the second on electricity and mass production, and the third on computers and automation, Industry 4.0 is being built on the promise of IoT technology.
As machines are being connected to the network, they allow visibility into their real-time performance for the first time. This information can then be translated to powerful insight and Business Intelligence that enable manufacturing managers to improve plant performance and productivity. Gradually, big data, machine learning and Artificial Intelligence can be harnessed for predictive maintenance and to further optimize production lines.
In order to benefit from Industry 4.0 and reap the rewards of digitalization, manufacturers first need to get past the hurdle of connectivity, dealing with tens of millions of legacy analogue machines. The latest innovative technology aims at bridging this gap by connecting machines to the cloud in a fast and non-intrusive way. Without the need for expensive new hardware or complex integrations, this technology eliminates the risk of voiding the warranty or interfering with manufacturing processes. Using a wide range of sensors, including vibration, acoustic and current sensors, and a cloud-based, Artificial Intelligence-powered Asset Performance Monitoring platform, the 3d Signals solution allows manufacturers to monitor the performance of their industrial machinery in real-time, and within hours from installation gain valuable insight and analysis on the availability and efficiency of their operation.
The solution was proven to:
Turn visibility to improved bottom line Real-time data gives customers the single pane of glass they need to spot bottlenecks and workflow issues, immediately identifying when problems arise.
In one real-life example from a customer, SAMSON AG, in Frankfurt, Germany, a manager saw remotely that a production cycle that should have been in progress over the weekend was not running to schedule. In fact, it had stalled entirely. With this visibility, he was quickly able to identify the problem – a staff member who had been unable to come to work due to sickness. By calling in emergency staff, the company was able to meet the deadline as planned. Without this visibility, the problem wouldn’t have been spotted until Monday morning, resulting in additional costs and delay of shipment.
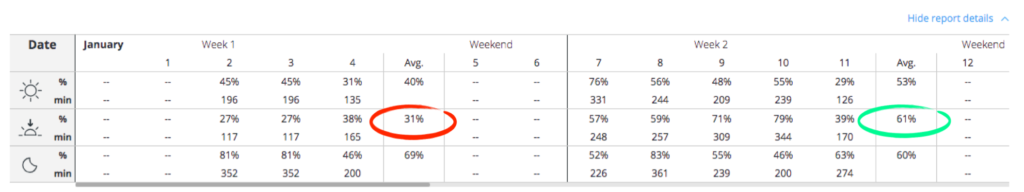
The above image from the shift comparison report shows how a Production Manager noticed a low productivity of a specific machine during the 2nd shift, compared to the 1st and 3rd shifts. Discussing this with the shift employees and understanding their issues immediately doubled the productivity of the machine during that shift.
Our advanced solution provides the data to make budgetary decisions simple. Machine idle time is tracked in minutes, allowing decision-makers to see which machines cause delay or losses in revenue, and are in need of replacement or maintenance, and what human errors are contributing to problems on the production floor. With real-time performance information at their fingertips, manufacturers can easily identify drains on resources, such as machines that are not performing to their maximum, or staff members and teams who need further training or support. In another example from SAMSON AG, operation managers identified an unplanned operation of a specific machine. Investigating into it they realized that raw materials arrived on Friday, requiring costly weekend shifts to complete production as planned. By shifting raw material delivery to earlier in the week they were able to eliminate those extra costs.
In addition to live and historical machine performance status, baselines and trends can also be tracked and monitored over time, and historical data can be used to pick up on patterns that may have been missed by the human eye. The sophisticated alerts mechanism enables fast response to any issue that arises.